4 July 2019 · 3 min read
Using Optuma’s Market Breadth Engine – Part 2
Last week I introduced breadth and touched on how you can use Optuma to build your own Breadth measures. This week I continue on to explain different ways in which you can use Breadth calculations in Optuma.

Calculating Market Cap Percentages in Your Portfolio
Let’s say I have 10 stocks in my portfolio, and I want to know how much each one represents as a percentage of the total market cap of all the stocks in my portfolio. This is important because smaller cap stocks tend to be more volatile, so I can make sure I have a balanced portfolio. To achieve this I sum up the market cap for my whole portfolio and compare each symbol’s market cap to the total.
In an Optuma watchlist we can have Summary and header rows—that Sum or Average all the rows in that group—but we cannot use that value in a calculation. This is where we can create a Breadth symbol and use that instead.
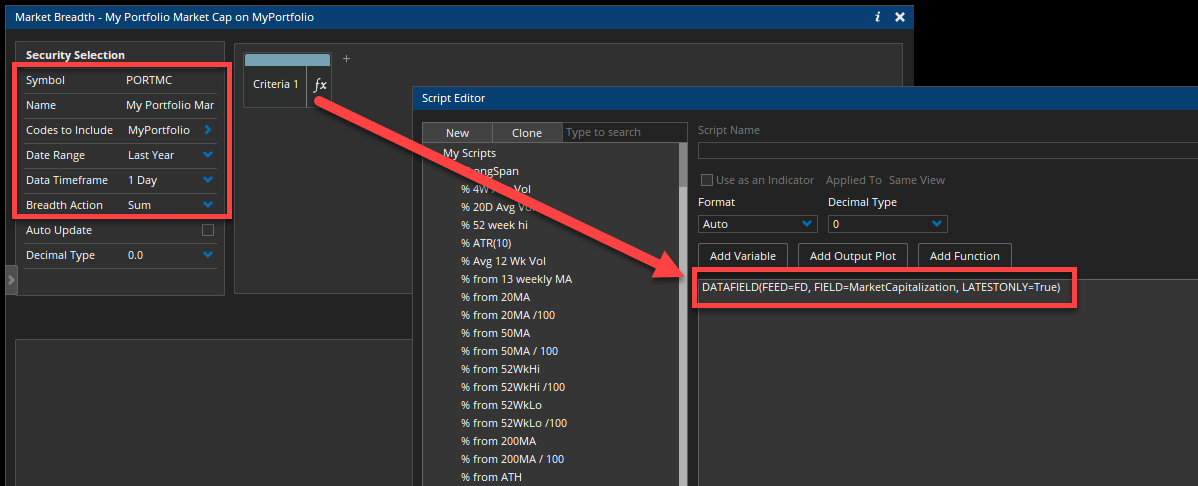
Having built a symbol list containing the 10 stocks (by either importing a .csv file, linking to a Bloomberg portfolio, or manually typing the symbols) you can use it in the Breadth engine to calculate the total market cap by using the DATAFIELD function to get the market cap (note: requires access to Optuma’s fundamental data):
DATAFIELD(FEED=FD, FIELD=MarketCapitalization, LATESTONLY=True)
In this example the custom ticker symbol I chose is PORTMC, calculated from MyPortfolio symbol list with the Breadth Action set to Sum:
This will create a data file called PORTMC which can be used in a watchlist column with the GETDATA function to calculate the ratio of our market cap to the total market cap we calculated in the breadth measure:
//Get the current market cap for each stock
MC1=DATAFIELD(FEED=FD, FIELD=MarketCapitalization, LATESTONLY=True);
//Get the PORTMC value calculated by the Breadth engine
MCTOT=GETDATA(CODE=PORTMC:Market Breadth);
//Calculate the ratio
(MC1 / MCTOT)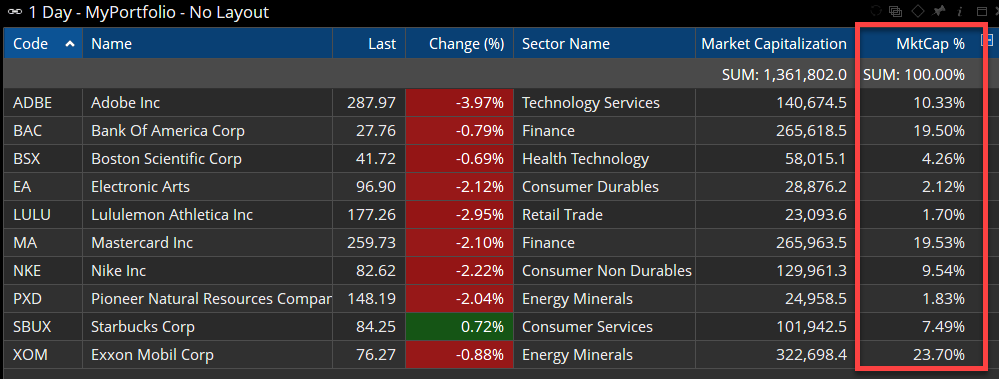
Out of my 10 stocks, Exxon Mobil (XOM) has a market cap of $322.7 billion, making up 23.7% of the overall market cap of $1.36 trillion.
Calculating a Price-Weighted Portfolio Performance
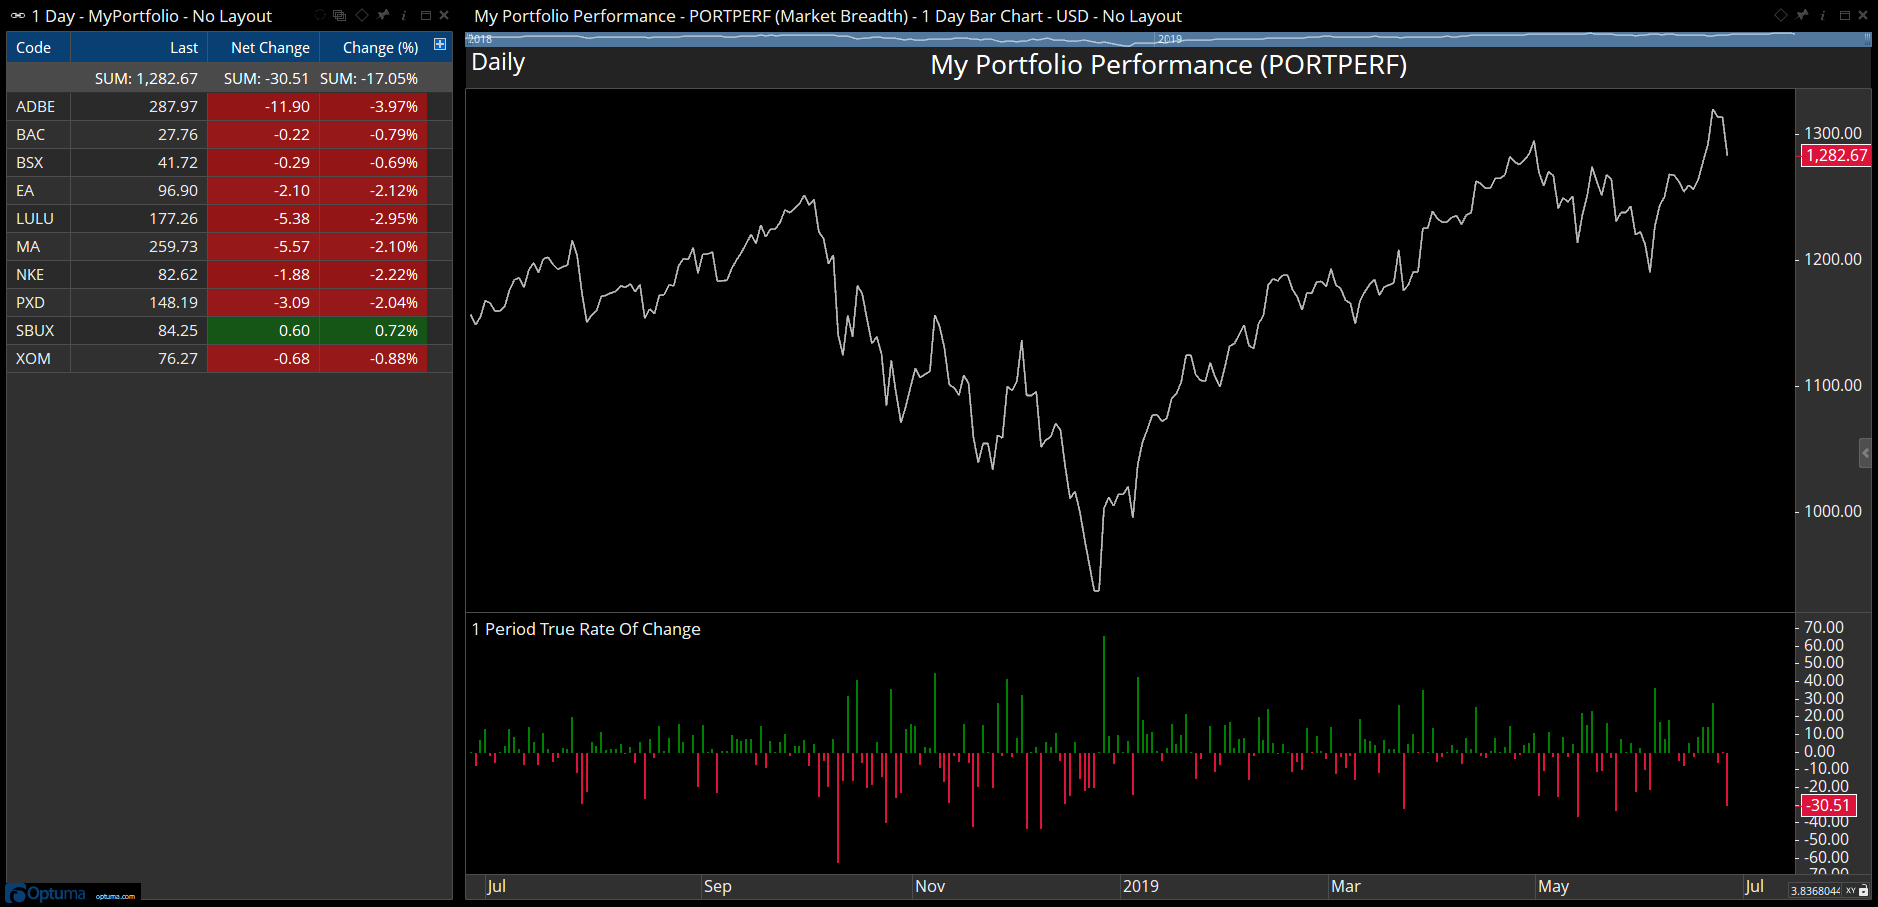
It’s also possible to sum the values of the portfolio stocks to create a total, thus giving a price-weighted proxy for the performance (note: we will be adding an option to create a geometric average in the breadth engine to make it easier to create an equal-weighted average, as discussed here That will be available in Optuma 1.5).
Instead of summing the market cap, simply sum the CLOSE() value. Doing this will add closing values for each day as per this example that shows the current sum of closing prices is 1,282.67, and net change of -30.51 from the previous session:
Once created, this data can also be used as the benchmark for a Relative Rotation Graph (RRG). Instead of using the main stock index, this makes it a ‘closed universe’ RRG (i.e. only those stocks in the RRG are in the benchmark):
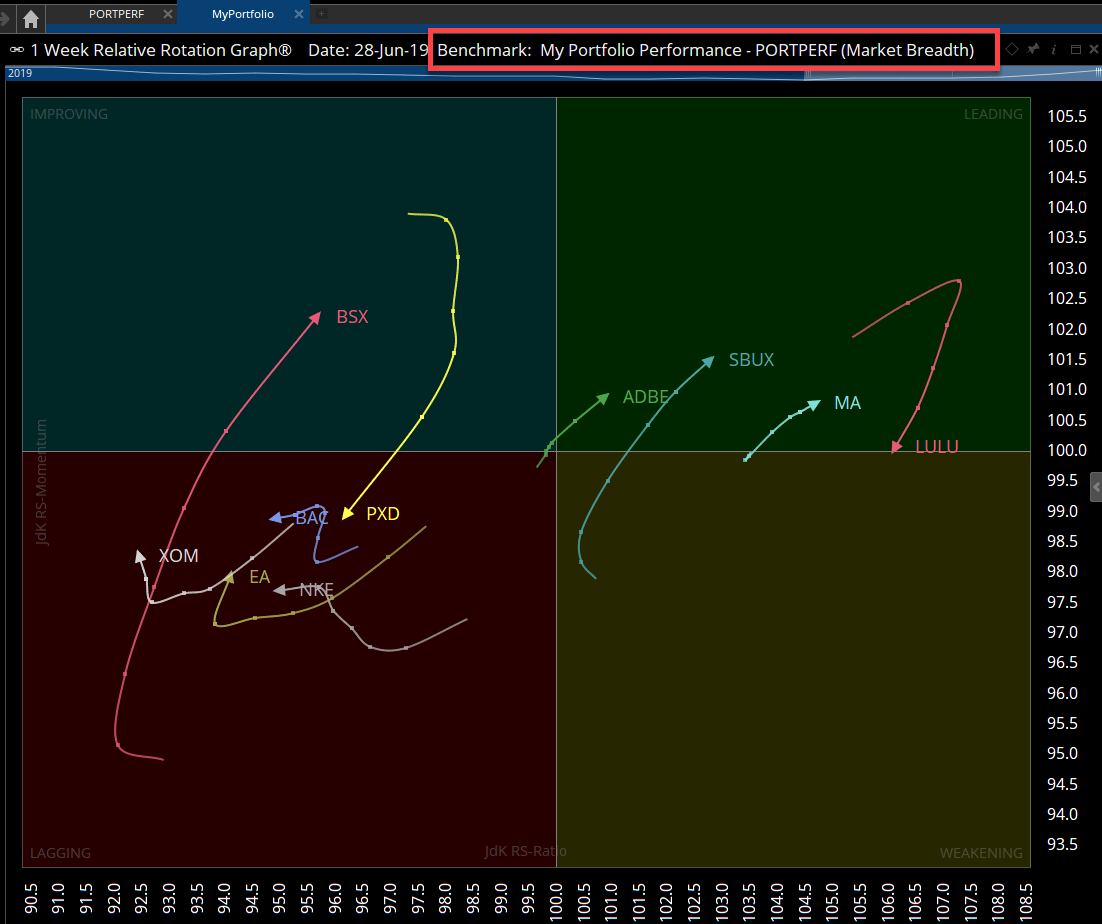
In RRGs, “closed universes” are important because we know there has to be balance in the RRG. This way we can see exactly which members of my portfolio are performing the best and which are contributing the least. I also get an inkling of which securities are likely to move into out-performance. Remember the weakest security in my portfolio could still be better than alternative securities in the whole market. This type of focussed RRG is telling me which are above average and which are below.
For a more detailed explanation of closed universes in RRGs, read my white paper called RRG Weights.
As with all things Optuma, you have an enormous amount of flexibility in how you use these measures. Hopefully you can find even more unique ways to use them.