1 September 2016 · 6 min read
Lies, Damned Lies, and Average Returns
Mark Twain popularised a famous saying that he attributed to the British Prime Minister Benjamin Disraeli: “There are three kinds of lies: lies, damned lies, and statistics”. As I’ve been focused so heavily on Signal Testing throughout 2016, I’ve been learning more and more about average returns. I want to change that quote to “lies, damned lies, and average returns”. I’ll explain why, and how we can fix the problem in a moment. First I need to explain a bit of the history that led us to build the Optuma Signal Tester.
The Signal Tester journey started for me in 2014 when I was running some backtests on RRG angles. I’d been thinking of the RRG as a compass and I wanted to know if a tradeable system existed by executing from different angles on the RRG (see my “Buying out-performers is too late” research paper for those results).

My first test, with an account size of $10,000, gave me some good results. Great! Let’s see what happens if I increase the capital to $100,000. Surely I would get a proportional lift in the results? What actually happened is that the results went down! What the? That didn’t make sense. On came the programming hat. I started to dig and look at what was happening.
I Got Lucky
It turned out that in the initial test I was victim to one of the fundamental flaws of backtesting. My position size was out of proportion with the starting capital. This meant that on a day where I had six signals, I only had enough capital to take three. Adding the extra capital meant that more signals (in this case the bad ones) were considered. Another term for this is “Path Dependency”. That is, my result is dependant on picking the right “path”—or combination—through so many rules.
In trading that’s life. We usually can’t take every signal. At this stage of my research though, I wanted to know if the signal was good (or at least better than others I’d been using). The more I thought about it, the more I realised that traditional backtesting (including the way we do it in Optuma) is taking a Buy Signal, a Sell Signal, position sizing, starting capital, pyramiding rules, stop losses and targets (let alone leverage), and throwing it all together to see what we get. That’s just way too many axis of freedom in one single test to be scientifically valid.
Bring On The Innovation
I wanted to know whether my signal was good or not. To get that answer, I needed to build the Optuma Signal Tester. This was great. It found every single instance of the signal and measured the returns over the 30 days following the signal. It then averaged up the returns to give me a wonderful average return number. Whoo-hoo, High-5’s all ‘round! At this point I was quite pleased with myself. I showed what we had done to Kirk Northington and Carson Dahlberg of ND Research in Charlotte, NC. These guys are the absolute world-leaders at taking Technical Analysis and thinking about it in a Quantitative way. I wanted to get their opinion on the Signal Tester.
Oh Boy! It really was one of those times where they smiled, patted me on the head (well, not literally, that would have been weird) and said, “Great Start, but what’s behind the average?” Huh? They patiently explained that an average is made up of lots of results, but our confidence in achieving the average needs to be explored. It’s easy to forget that an average is made up of lots of values. Talk about a BFO (Blinding Flash of the Obvious). It’s so easy to forget that summary statistics are a guide, not a certainty.
The spread of those values determines how valid the average is. For example, these two number sets have the same average (49,50,51) and (0, 50, 100), but the first series gives us much more confidence that the next value will be close to the average. The second set will get the same average, but the volatility is huge.
Anscombe’s Quartet
As a reference of how dangerous statistics can be, you should have a look at Anscombe’s quartet. It does a great job of explaining how four sets of values can give the exact same summary statistical results. It’s obvious to us that the results are different, but that information is hidden by the statistics.
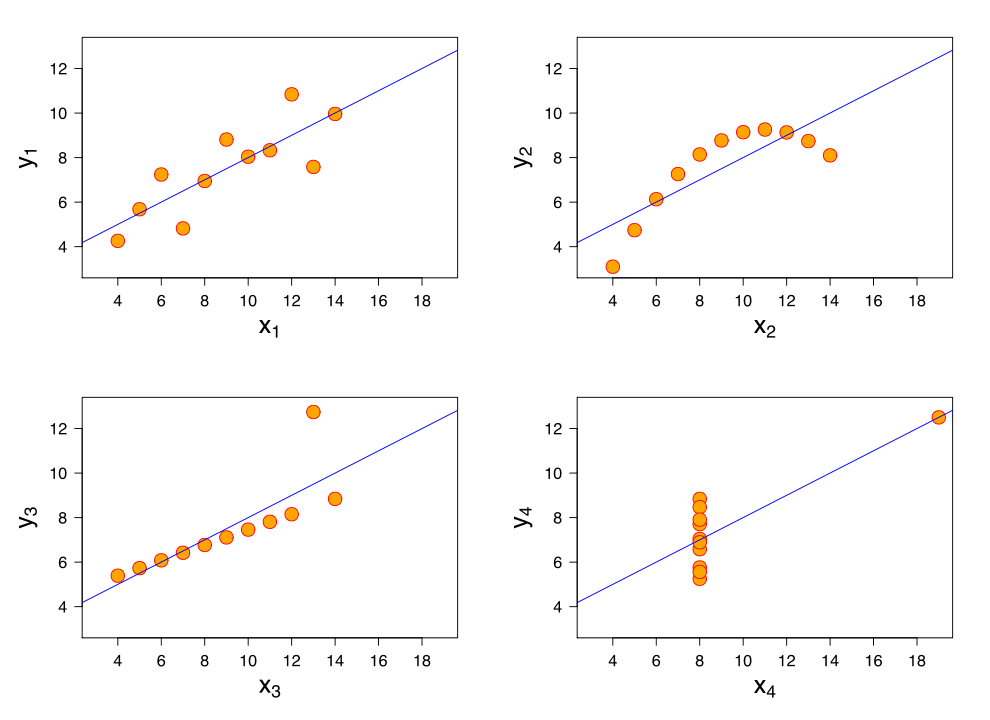
The key point is that we need to look into the results to see what the results are made up of. If there is only one thing you take away from this post, please let it be that you need to be suspicious when someone quotes you an average return from tests or trading results. Sure— they may have a 10% average return from their RIA—but what is the spread of the trades? Did they just get lucky on one big trade? Or are they consistently getting returns with a low spread?
s
You need to be suspicious when someone quotes you an average return from tests or trading results
Armed with that revelation, we set about designing the new updated Signal Tester.
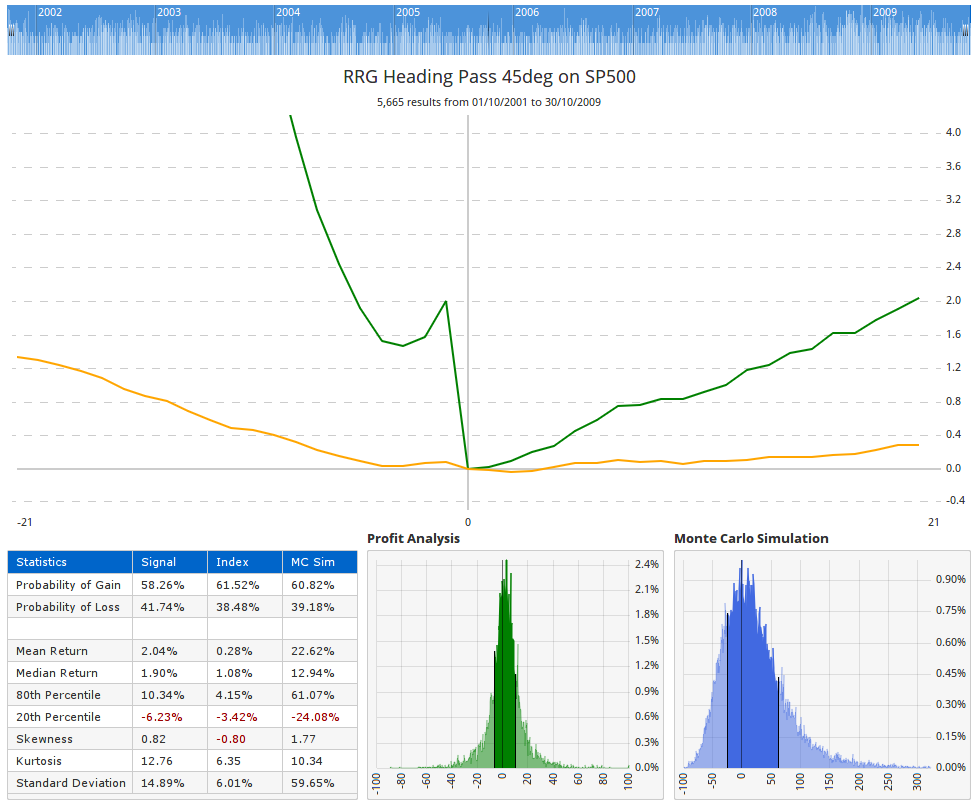
We’ll cover a lot of the different sections over the next few weeks, but by far the most important inclusion is the Profit Analysis chart which lets us look inside the average returns.
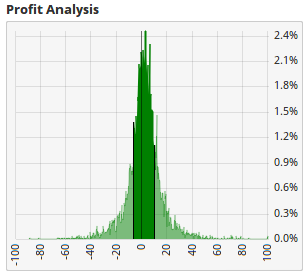 This chart takes all of the returns for each of the signals and puts them into half percent buckets. It then counts how big each “bucket” is and plots it.
In the Profit Analysis chart, we want to see a “High and Tight” distribution. This is telling us that there is a significant number of signals that are supporting the average. If the distribution was “low and wide” then we know that the likelihood of future signals landing near the average is very low.
Won’t Both Produce The Average?
It could be argued that over time you will eventually get the same result if it was High and Tight or Low and Wide. My response would be that a Signal that has a High and Tight profit analysis is going to make it a lot easier to sleep at night. Particularly if you are managing someone else’s money. It is more important to have a high probability of making small profits, than it is to make one big profit (Lottery Trading). I want signals that give me a much higher probability of hitting the average every time I enter a trade. If a new signal can get me the same result with half the volatility—I’m taking it!
The other thing I want to see is the peak of the distribution skewed to the right. This one is slightly. That’s telling me that every time I take this signal, I am more likely to turn a profit than a loss.
Next time we’ll dig into the Statistics on the Signal Tester. I hope you now understand why I now group “average returns” with lies and damned lies. The average return is an important number that helps compare one system versus another, but there is important information that can be hidden behind the average. My hope is that being armed with this knowledge will help you avoid being duped, and also help you examine your own strategies in a new way.